Kim PepperCo-Founder & Tech Director
For many agencies, and large organisations that have tens or hundreds of Drupal sites, it can be difficult to keep tabs on which sites have what modules installed and whether they are up to date or not. Manually crawling through each site can be time consuming and error prone.
In this post, I describe a solution that allows you to keep a dashboard of site status information that you can query to find out precisely what is going on on each of your sites.
Drupal has had the ability to send email notifications when security updates are required. However, if you have a large volume of sites, there is a high signal to noise ratio, and often a critical security update will get missed.
There are a number of existing solutions out there. Why would we build our own?
After an evalutaion, there were a number of compelling reasons to roll our own:
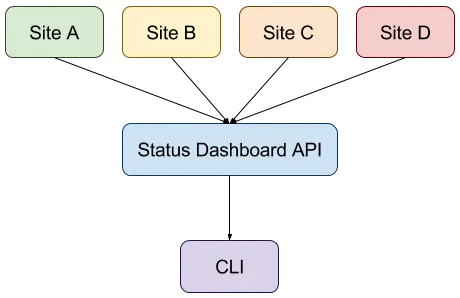
Our solution to the problem was to create a centralised Status Dashboard API which collects information from each site, and provides an API to query that information.

Each site has a number of configured checkers which are triggered when cron runs. The checks returned are aggregated together and pushed to the Status Dashboard API as a snapshot of the status at one point in time.
Each check stores a type, a name and an alert level. Alert levels are: notice, warning, and error. Checkers are simple CTools plugins which implement CheckerInterface which has a single method getChecks() to return an array of check data.
Current checkers include:
It is easy to implement your own by creating a CTools checker plugin.
The dashboard API is a simple REST web service built on Silex. Sites push their data with a unique key, and require authentication over secure HTTPS. The snapshot data is stored in a MySQL database, but treated as ephemeral, it does not matter if it gets deleted, as it will get re-populated with a new snapshot the next time cron runs on a site.
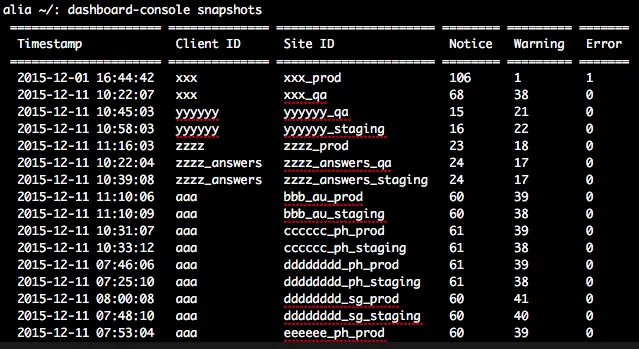
The API allows you to view all snapshots for all sites as one big chunk of JSON. Each snapshot provides a summary of the number of alerts by level. This makes it easy to find sites with error alerts quickly. You can also apply a filter to show only sites with an error alert.
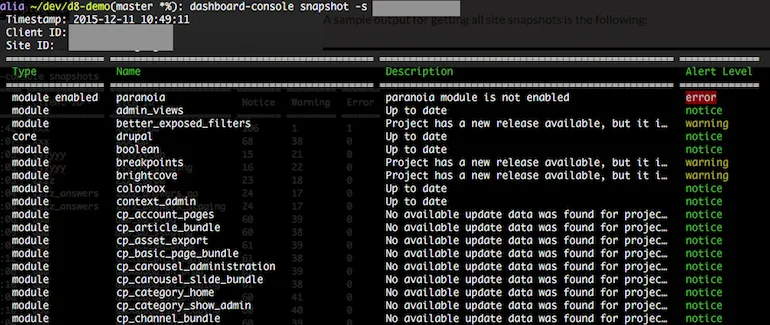
You can view the snapshot details for a specific site keyed by its unique site ID to see each check and its alert level. You can also filter these to show only the checks for a site which have an error alert level. This allows you to easily find which checks are causing all the problems.
Of course, trying to read JSON regularly isn't much fun. So we built a simple Command Line Interface (CLI) tool called Dashboard Console using Symfony Console to do the work of querying the Status Dashboard API and returning the results in a nice human-readable format.
A sample output for getting all site snapshots is the following:


We're happy to release two of these components: Dashboard Connector and dashboard-console, as open source. You can download Dashboard Connector from Drupal.org at https://www.drupal.org/project/dashboard_connector while the Dashboard Console CLI utility is available on Github at https://github.com/previousnext/dashboard-console
Of course, you will need to build your own Dashboard API, but that will be simple enough once we publish the API documentation.
For the first round of development, we took an API-first approach, supported by simple command line tools. This gives us the benefit of being able to spin something up quickly, and gives us agility to make changes when necessary. Possible future development work could include supporting alternate authentication methods, and a web-based interface for view snapshots, and querying them.